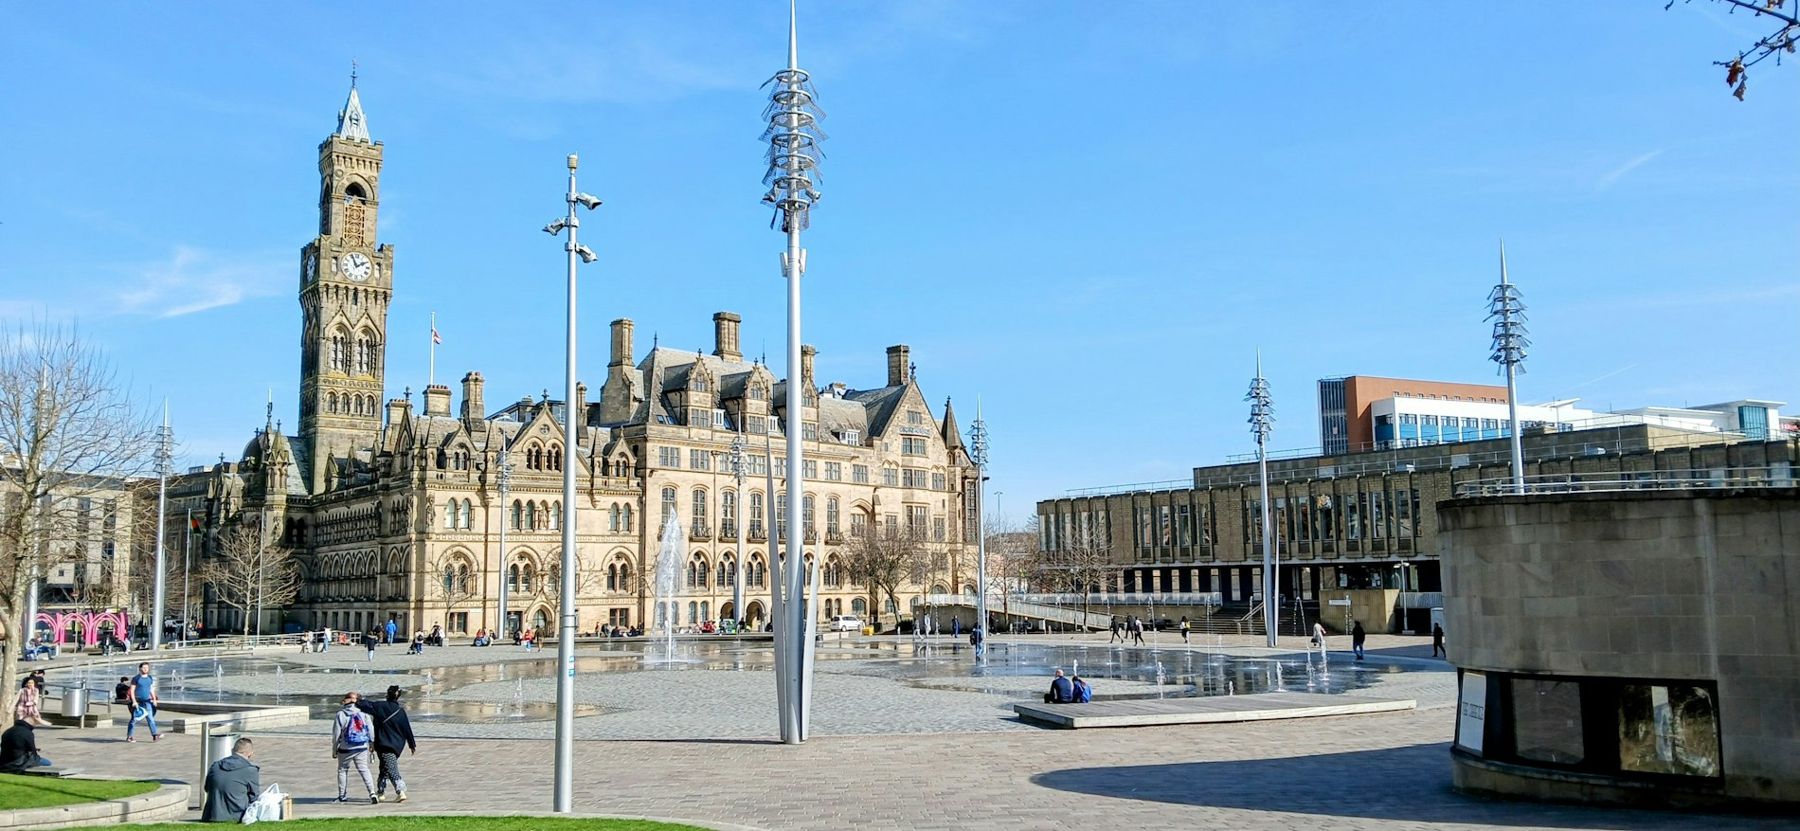
Why we invest across the Bradford District.
Keighley to Tong, Ilkley to Queensbury: a £11.7bn economy of 563,600 people, with rents rising and prices still well below the national average — and the local knowledge to find the best of it.
Eight reasons the district stacks up.
Tap any figure for the detail — and for where it comes from.
Source: Office for National Statistics, September 2026; University of Bradford; Bradford 2025 City of Culture. Figures are district-wide averages, not a forecast for any individual property.
Know the district street by street.
From city-centre student lets to commuter towns on the Airedale and Wharfedale lines — select an area to explore.
Big employers, steady tenants.
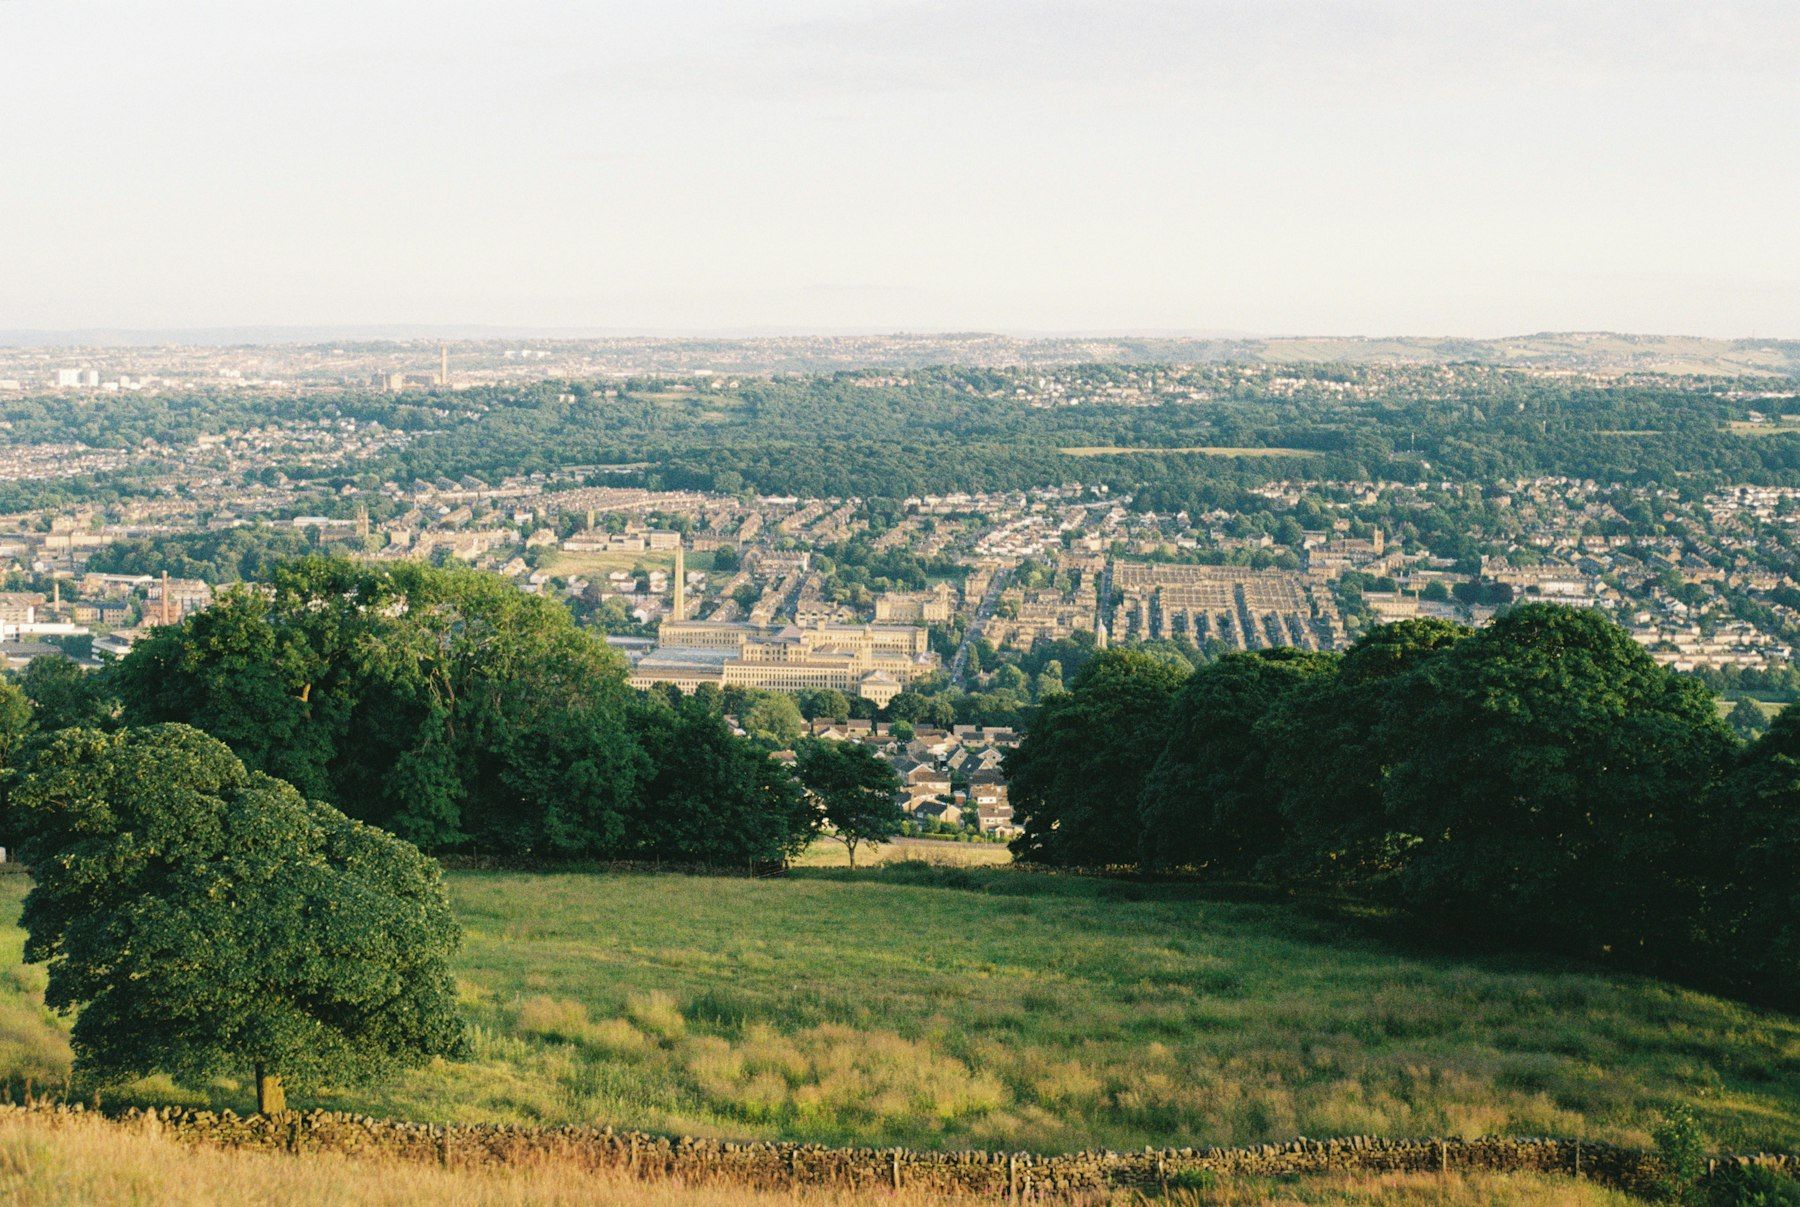
Model a Bradford deal.
Start from the district's average rent of £745 a month and see how a discounted purchase performs.
Deal analyser
Model any Bradford deal in seconds — discount, yield, stamp duty and cash flow.
Illustrative only. Net figures assume 22% of rent for management, maintenance, insurance and voids; mortgage at 75% LTV, 5.5% interest-only; £3,500 legal & survey fees. Stamp duty uses England higher rates for additional homes. Not financial advice.
Book your free strategy call
A no-pressure 15-minute conversation about your goals, your budget and the opportunities across the Bradford District right now.